Explanation:
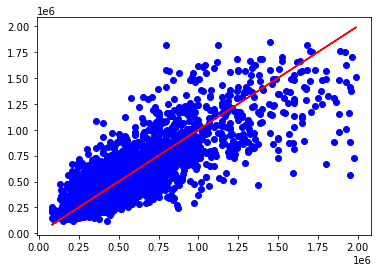
Linear Regression is a plot that models the relationship between two variables and finds the linear relation of the data. It then draws a line of best fit which allows for more accurate predictions.
Our Results:
For our linear regression graph we compared the actual price to the predicted price to see if there were any trends in the data. We ended up with a very high score of 80% and a Mean Absolute Error of 84,804.
Explanation:
A Decision Tree is used the categorize or make predictions based on how the previous set of questions was answered.
Our Results:
For our Decision Tree we compared how variable like bedrooms, bathrooms, square footage,etc, affects the total price of a house. We ended up with a score of 69% and a Mean Absolute Error of 103,547.
Explanation:
A Neural Network is a machine learning tool that teaches the machine to process data in a way that is similar to the human brain. Neural Networks are comprised of an input layer, hidden layers, and a output layer that are connected via nodes. This allows they AI to learn form it's mistake and provide accurate results.
Our Results:
For our Neural Network we compared how the variables affected the total price. We ended up getting a very high score of 81% and a Mean Absolute Error of 80,285.